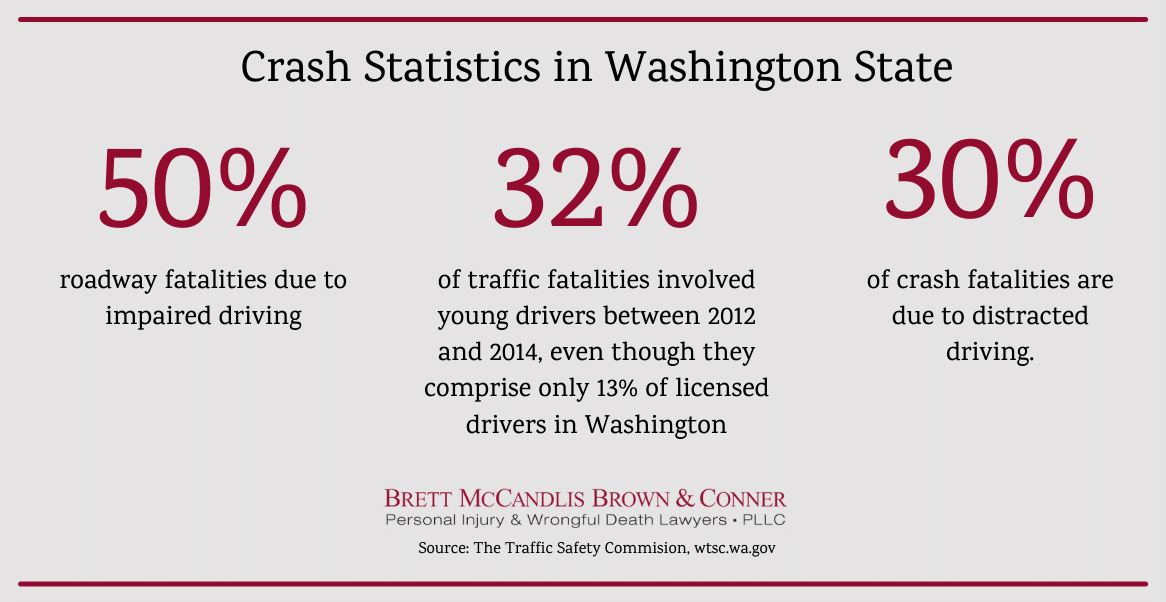
Car accidents are one of the leading causes of preventable injury in Washington State. In fact, over the past five years, an average of more than 500 people died in fatal Washington car accidents. The vast majority of these accidents could have been avoided had drivers taken the necessary precautions. However, despite the high rate of car accidents in WA, motorists continue to take liberties behind the wheel, putting everyone else on the road at risk.
Washington Roads Proved to Be Very Dangerous in 2020
Every time you get into a car, there is a chance—albeit a small one—that you’ll be the victim of a car accident. Washington is a large state, with a mix of rural roads, state highways, urban roads, and interstate highways. Not surprisingly, some areas are more dangerous than others.
Accidents do happen daily in the United States. According to the Association for Safe International Road Travel1, approximately 1.35 million people annually are involved in fatal road accidents and more than 1 million days are spent in hospitals each year from these accidents says the Centers for Disease Control and Prevention2.
Of course, you need to realize that the United States has approximately 328.8 million people according to the U.S. Census3. Therefore, the odds that you will join the 1.35 million harmed per year are considerably low. This doesn’t mean that you should drive haphazardly and assume that the odds will forever be in your favor either. Instead, it is about being an informed driver and conscious of the risks around you so that you can avoid becoming next year’s statistic.
What Are the Most Dangerous Roads in Washington State?
 | ||||
| Location | Total of Collisions | People Involved in Suspected Serious Injury Crashes | People Involved in Fatal Crashes | Danger Score |
|---|---|---|---|---|
| State Highway 2, Washington, USA | 9 | 23 | 9 | 304 |
| State Highway 7, Washington, USA | 11 | 23 | 8 | 286 |
| State Highway 17, Washington, USA | 5 | 3 | 12 | 260 |
| State Highway 9, Washington, USA | 11 | 27 | 5 | 246 |
| State Highway 101, Washington, USA | 6 | 16 | 7 | 226 |
| State Highway 20, Washington, USA | 7 | 18 | 6 | 217 |
| State Highway 290, Washington, USA | 7 | 12 | 7 | 207 |
| State Highway 3, Washington, USA | 7 | 15 | 5 | 182 |
| I-90 | 5 | 12 | 5 | 165 |
| State Highway 303, Washington, USA | 5 | 8 | 6 | 165 |
How We Determine the Most Dangerous Roads in Washington State
Our list of the most dangerous roads in WA is based on each road’s “danger score”. To come up with the danger score, we start with the total number of accidents. This information is available through the Washington Department of Transportation4. From there, we assign a weight of five to each accident that resulted in serious injury and a weight of 20 to each accident resulting in a fatality. We add each of these weighted numbers to the total number of accidents to come up with the road’s danger score.
For example, there were a total of 9 car accidents on State Highway 2. According to accident statistics compiled by the Washington Department of Transportation, there were 23 people seriously injured in these accidents and nine fatalities. So, to come up with the danger score for State Highway 2, the calculation is as follows: 9 + (9 x 20) + (23 x 5). Thus, the total danger score for State Highway 2 is 304.
Washington Cities with the Highest Number of Fatal Car Accidents
According to the most recent data released by the Washington Traffic Safety Commission5 and Washington State Department of Transportation4, the following cities experienced the highest number of fatal car accidents.
- Seattle
- Tacoma
- Kent
- Everett
- Vancouver
- Auburn
- Spokane Valley
- Federal Way
- Tukwila
- Yakima
- Puyallup
Seattle
23
Number of fatal collisions
25
Number of fatalities from collisions
404
Total Alcohol Involved Crashes
54
Total Cell Phone Involved Crashes
528
Total Teen Drivers (age 16-19) Involved Crashes
Tacoma
15
Number of fatal collisions
18
Number of fatalities
184
Total Alcohol Involved Crashes
19
Total Cell Phone Involved Crashes
404
Total Teen Drivers (age 16-19) Involved Crashes
Kent
10
Number of fatal collisions
10
Number of fatalities
94
Total Alcohol Involved Crashes
13
Total Cell Phone Involved Crashes
245
Total Teen Drivers (age 16-19) Involved Crashes
Everett
14
Number of fatal collisions
14
Number of fatalities
105
Total Alcohol Involved Crashes
15
Total Cell Phone Involved Crashes
288
Total Teen Drivers (age 16-19) Involved Crashes
Vancouver
14
Number of fatal collisions
15
Number of fatalities
201
Total Alcohol Involved Crashes
21
Total Cell Phone Involved Crashes
294
Total Teen Drivers (age 16-19) Involved Crashes
Auburn
7
Number of fatal collisions
7
Number of fatalities
76
Total Alcohol Involved Crashes
15
Total Cell Phone Involved Crashes
131
Total Teen Drivers (age 16-19) Involved Crashes
Spokane Valley
8
Number of fatal collisions
8
Number of fatalities
75
Total Alcohol Involved Crashes
15
Total Cell Phone Involved Crashes
171
Total Teen Drivers (age 16-19) Involved Crashes
Federal Way
6
Number of fatal collisions
6
Number of fatalities
72
Total Alcohol Involved Crashes
8
Total Cell Phone Involved Crashes
228
Total Teen Drivers (age 16-19) Involved Crashes
Tukwila
8
Number of fatal collisions
8
Number of fatalities
59
Total Alcohol Involved Crashes
9
Total Cell Phone Involved Crashes
113
Total Teen Drivers (age 16-19) Involved Crashes
Yakima
6
Number of fatal collisions
7
Number of fatalities
82
Total Alcohol Involved Crashes
8
Total Cell Phone Involved Crashes
247
Total Teen Drivers (age 16-19) Involved Crashes
Puyallup
5
Number of fatal collisions
6
Number of fatalities
49
Total Alcohol Involved Crashes
3
Total Cell Phone Involved Crashes
116
Total Teen Drivers (age 16-19) Involved Crashes
Additionally, the total number of fatal crashes in 2020 was 522. The top five counties for fatal collisions are:
- King County with 101 fatal collisions,
- Pierce County with 63 fatal collisions,
- Spokane County with 50 fatal collisions,
- Snohomish County with 46 fatal collisions, and
- Clark County with 35 fatal collisions.
While the figures might seem relatively low, keep in mind that these numbers reflect only the number of fatalities. There are, of course, many more accidents on Washington roads that happen each year that result in non-fatal injuries to those involved. Also, the numbers may seem low because the data remains preliminary until it’s finalized at the end of the following year.
Although an accident can happen any day, the risk of a fatal one goes up on the weekend, especially on a Friday or Saturday. 37.93% of fatal accidents occurred on these two days:
- 100 fatalities on Friday; and
- 98 fatalities on Saturday.
You might assume that the worst time for fatalities is late at night when restaurants and bars are closing. However, over half of all fatalities occurred between 3 p.m. and 11:59 p.m.
- 107 fatalities occurred between 6 p.m. and 8:59 p.m.;
- 98 fatalities occurred between 3 p.m. and 5:59 p.m.; and
- 80 fatalities occurred between 9 p.m. and 11:59 p.m.
It’s imperative to drive defensively at all times and do your best to avoid being in an accident. You cannot control what other drivers do on the road, but you can do your best to watch out for negligent or reckless drivers.
Common Causes of Car Crashes
For 2020, the following were some of the most common causes of traffic-related deaths within the state of Washington:
Driving Under the Influence of Drugs or Alcohol: Driving under the influence of drugs or alcohol accounted for 275 fatal collisions. Of those involved in those crashes, 71 tested positive for alcohol, 113 tested positive for drug use, and 91 tested positive for both drugs and alcohol. Driving under the influence is not limited to drugs or illegal drugs—it can include prescription medication as well.
Anything that causes a driver’s ability and judgment to be compromised can lead to an accident. They may fall asleep behind the wheel, become reckless, or have delayed reaction times. Even drivers who have been drinking but are under the legal limit may be impaired and pose a risk to other drivers’ lives every time they get behind the wheel of a car.
Distracted driving – Distracted drivers caused 90 fatal collisions in 2020. While most people think of texting and driving, distracted driving includes anything that takes a driver’s attention away from the road. Other possible distractions include eating while driving, changing the radio station, looking at the GPS, talking to other passengers, etc. Whenever a driver takes their eyes off the road, lets their mind wander elsewhere, or takes their hand(s) off the wheel, it could potentially result in a deadly distracted driving accident.
Teenage drivers – In 2020, teenage drivers accounted for a minimum of 75 fatal collisions. Age groups recorded in the 2020 results are 16 to 17 year old drivers, which had 19 fatal crashes, and 18 to 20 year old drivers, which had 56. Teenage drivers are less experienced behind the wheel compared to older drivers. They are also more likely to engage in risky driving habits, such as speeding, reckless behaviors, distracted driving, and driving while impaired by alcohol or drugs.

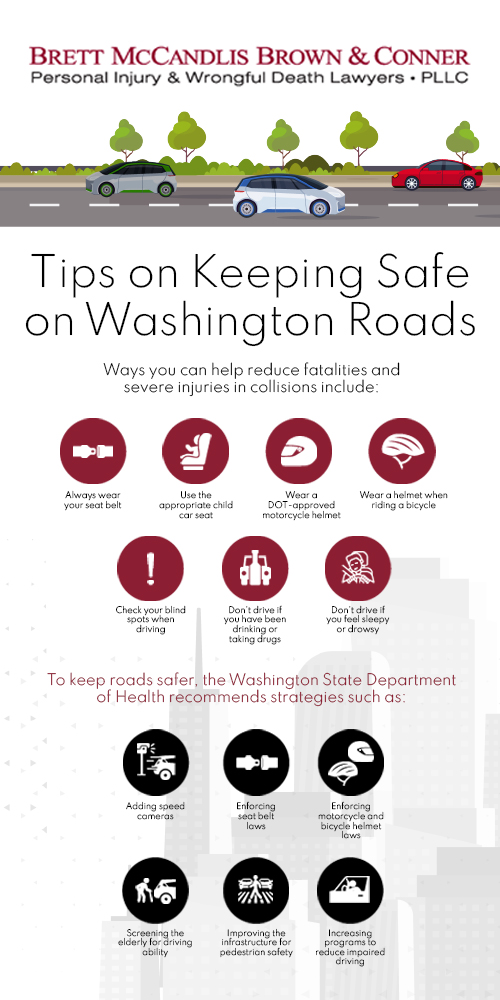
Tips on Keeping Safe on Washington Roads
Washington is making it a priority to reduce hospitalizations and fatalities6 related to traffic collisions. Driver and occupant behaviors are responsible for the majority of traffic collisions in the state. Washington’s rates are lower than the national average, but motor vehicle collisions remain the second-leading cause of unintentional injury-death and the leading cause of major trauma in the state.
Various initiatives and programs can keep our roads safer than they are. Because younger drivers tend to be riskier, Washington State now has an Intermediate Driver’s License (IDL) for new drivers under 18. This license works by helping younger and more inexperienced drivers to develop and improve their driving skills. If someone with an IDL commits an offense, the punishment is tiered. Since Washington implemented the IDL, there’s been a 41% drop in the number of disabling injuries and fatalities among new drivers between the ages of 16 and 17.

Keeping Washington roads safe is everyone’s job. Driver and passenger behaviors are largely responsible for all motor vehicle collisions in the state. The top three impairments in fatal accidents involve:
- Alcohol, illegal drugs, prescription medication, and over-the-counter medicine;
- Run-off-the-road collisions; and
- Speeding vehicles.
While weather, poor road design, and defective vehicle parts play a role in Washington’s fatality rate, the primary cause is human error. Don’t forget to look out for pedestrians, bicycles, and motorcycles when you’re driving as they may be in your blind spots. Remember, many fatalities are preventable. By driving defensively and always following applicable laws and regulations, you can do your part to help reduce the risk of catastrophic or fatal accidents in Washington.
Sources:
1Q, A. (2021, August 25). Road Safety Facts. Association for Safe International Road Travel. https://www.asirt.org/safe-travel/road-safety-facts/
2Motor Vehicle Crash Injuries. (2014, October 7). Centers for Disease Control and Prevention. https://www.cdc.gov/vitalsigns/crash-injuries/index.html
3Population Clock. (n.d.). U.S. Census Bureau. https://www.census.gov/popclock/
4WSDOT – Crash Data Portal. (n.d.). Washington State Department of Transportation. https://remoteapps.wsdot.wa.gov/highwaysafety/collision/data/portal/public/
5Fatal Collision Dashboard. (2021, October 6). Washington Traffic Safety Commission. https://wtsc.wa.gov/research-data/fatal-collision-dashboard/
6Washington State Injury and Violence Prevention Guide. (n.d.). Motor Vehicle-Related Injuries. Washington State Department of Health. https://www.doh.wa.gov/portals/1/Documents/2900/DOH530090MtrVeh.pdf